Let's face it — the financial markets are not fair. Every price movement in any stock or currency hides a complex structure, which is created by big players like hedge funds, big banks, and other hidden authorities working in the financial markets. This information is not available to the public. They work behind the scenes, and at some level they also control the financial markets, whether it is trading, investing, or other financial matters we know. These institutions use carefully designed strategies to exploit everyday traders, and if you don't understand their methods or systems, it is not easy to survive in the financial markets. By digging deeper into how these financial giants operate, you'll see how they influence prices, trap retail traders, and consistently generate billions in profits. Knowing their tactics isn't just interesting — it's essential if you want to survive, thrive, or dominate in the financial markets.
At the heart of today's financial markets is a simple truth: big institutions rely on liquidity to move their huge orders. Surprisingly, much of this liquidity comes from everyday traders — through their stop-loss triggers, emotional reactions, and predictable trading habits. Those sudden spikes, false breakouts, or market reversals that feel like "bad luck"? More often than not, they're carefully planned moves by these institutions, meant to create the flow they need before the real price action takes off.
Who Really Moves the Market? The Hidden Players
Retail traders usually think of "the market" as buyers and sellers. In reality, a layered network of institutions sits behind every price tick:
- Prime brokers — supply hedge funds with leverage, securities lending, and trade clearing.
- Clearing houses (CCPs) — sit between every buyer and seller and absorb counterparty risk.
- Custodian banks — hold and administer assets for large institutional clients.
- Central securities depositories (CSDs) — maintain the official record of who owns what.
- Market makers / liquidity providers — continuously quote buy and sell prices, supplying the market's liquidity.
- Dark pools — private venues where large institutional orders execute away from public view.
- Securities-financing firms — facilitate repo and securities lending that fund institutional positions.
- Family offices — manage large private wealth without the public profile of a named fund.
- Hedge funds and proprietary trading firms — deploy large, often undisclosed strategies.
- Sovereign wealth funds — government-owned capital pools large enough to move entire markets.
How They Are Connected
The key is to understand that these institutions don't form a single chain where one entity tells where the next movement of price is going to happen, up or down. They form a network, and their orders, hedging, financing, and risk management collectively create supply and demand, which leads to price movements.
The price-generation mechanism is simple:
Orders + liquidity + hedging + arbitrage + forced buying/selling → price discovery
So if you don't want to be tricked by banks and other big players, remember one thing: price moves when aggressive orders consume available liquidity. Also, instead of asking "who controls the market?" a better question is: "where does liquidity reside, who needs to transact, and what happens when that liquidity gets consumed?" To know where liquidity resides — and where price is likely to move once that liquidity is taken — there are several methods, such as technical analysis, ICT concepts, price action, and candlestick formations, which can indicate where liquidity is, though not with certainty. There are also tools like order flow, which let you see live orders and where large orders are executed or resting. But banks and big players see this information too, along with other hidden information they have, which lets them manipulate prices more easily.
All the trades you execute are visible to big players (banks, hedge funds, institutions), and they use this information to bet against you.
Methods Banks Use to Trick You
Liquidity Sweeps and False Breakouts
Liquidity sweeps and false breakouts occur when price briefly moves beyond a key level to trigger stops before reversing. Smart Money Concept (SMC) traders treat these sweeps as entry signals, not exit points. Once the liquidity is captured, positions are filled, and the real move begins.
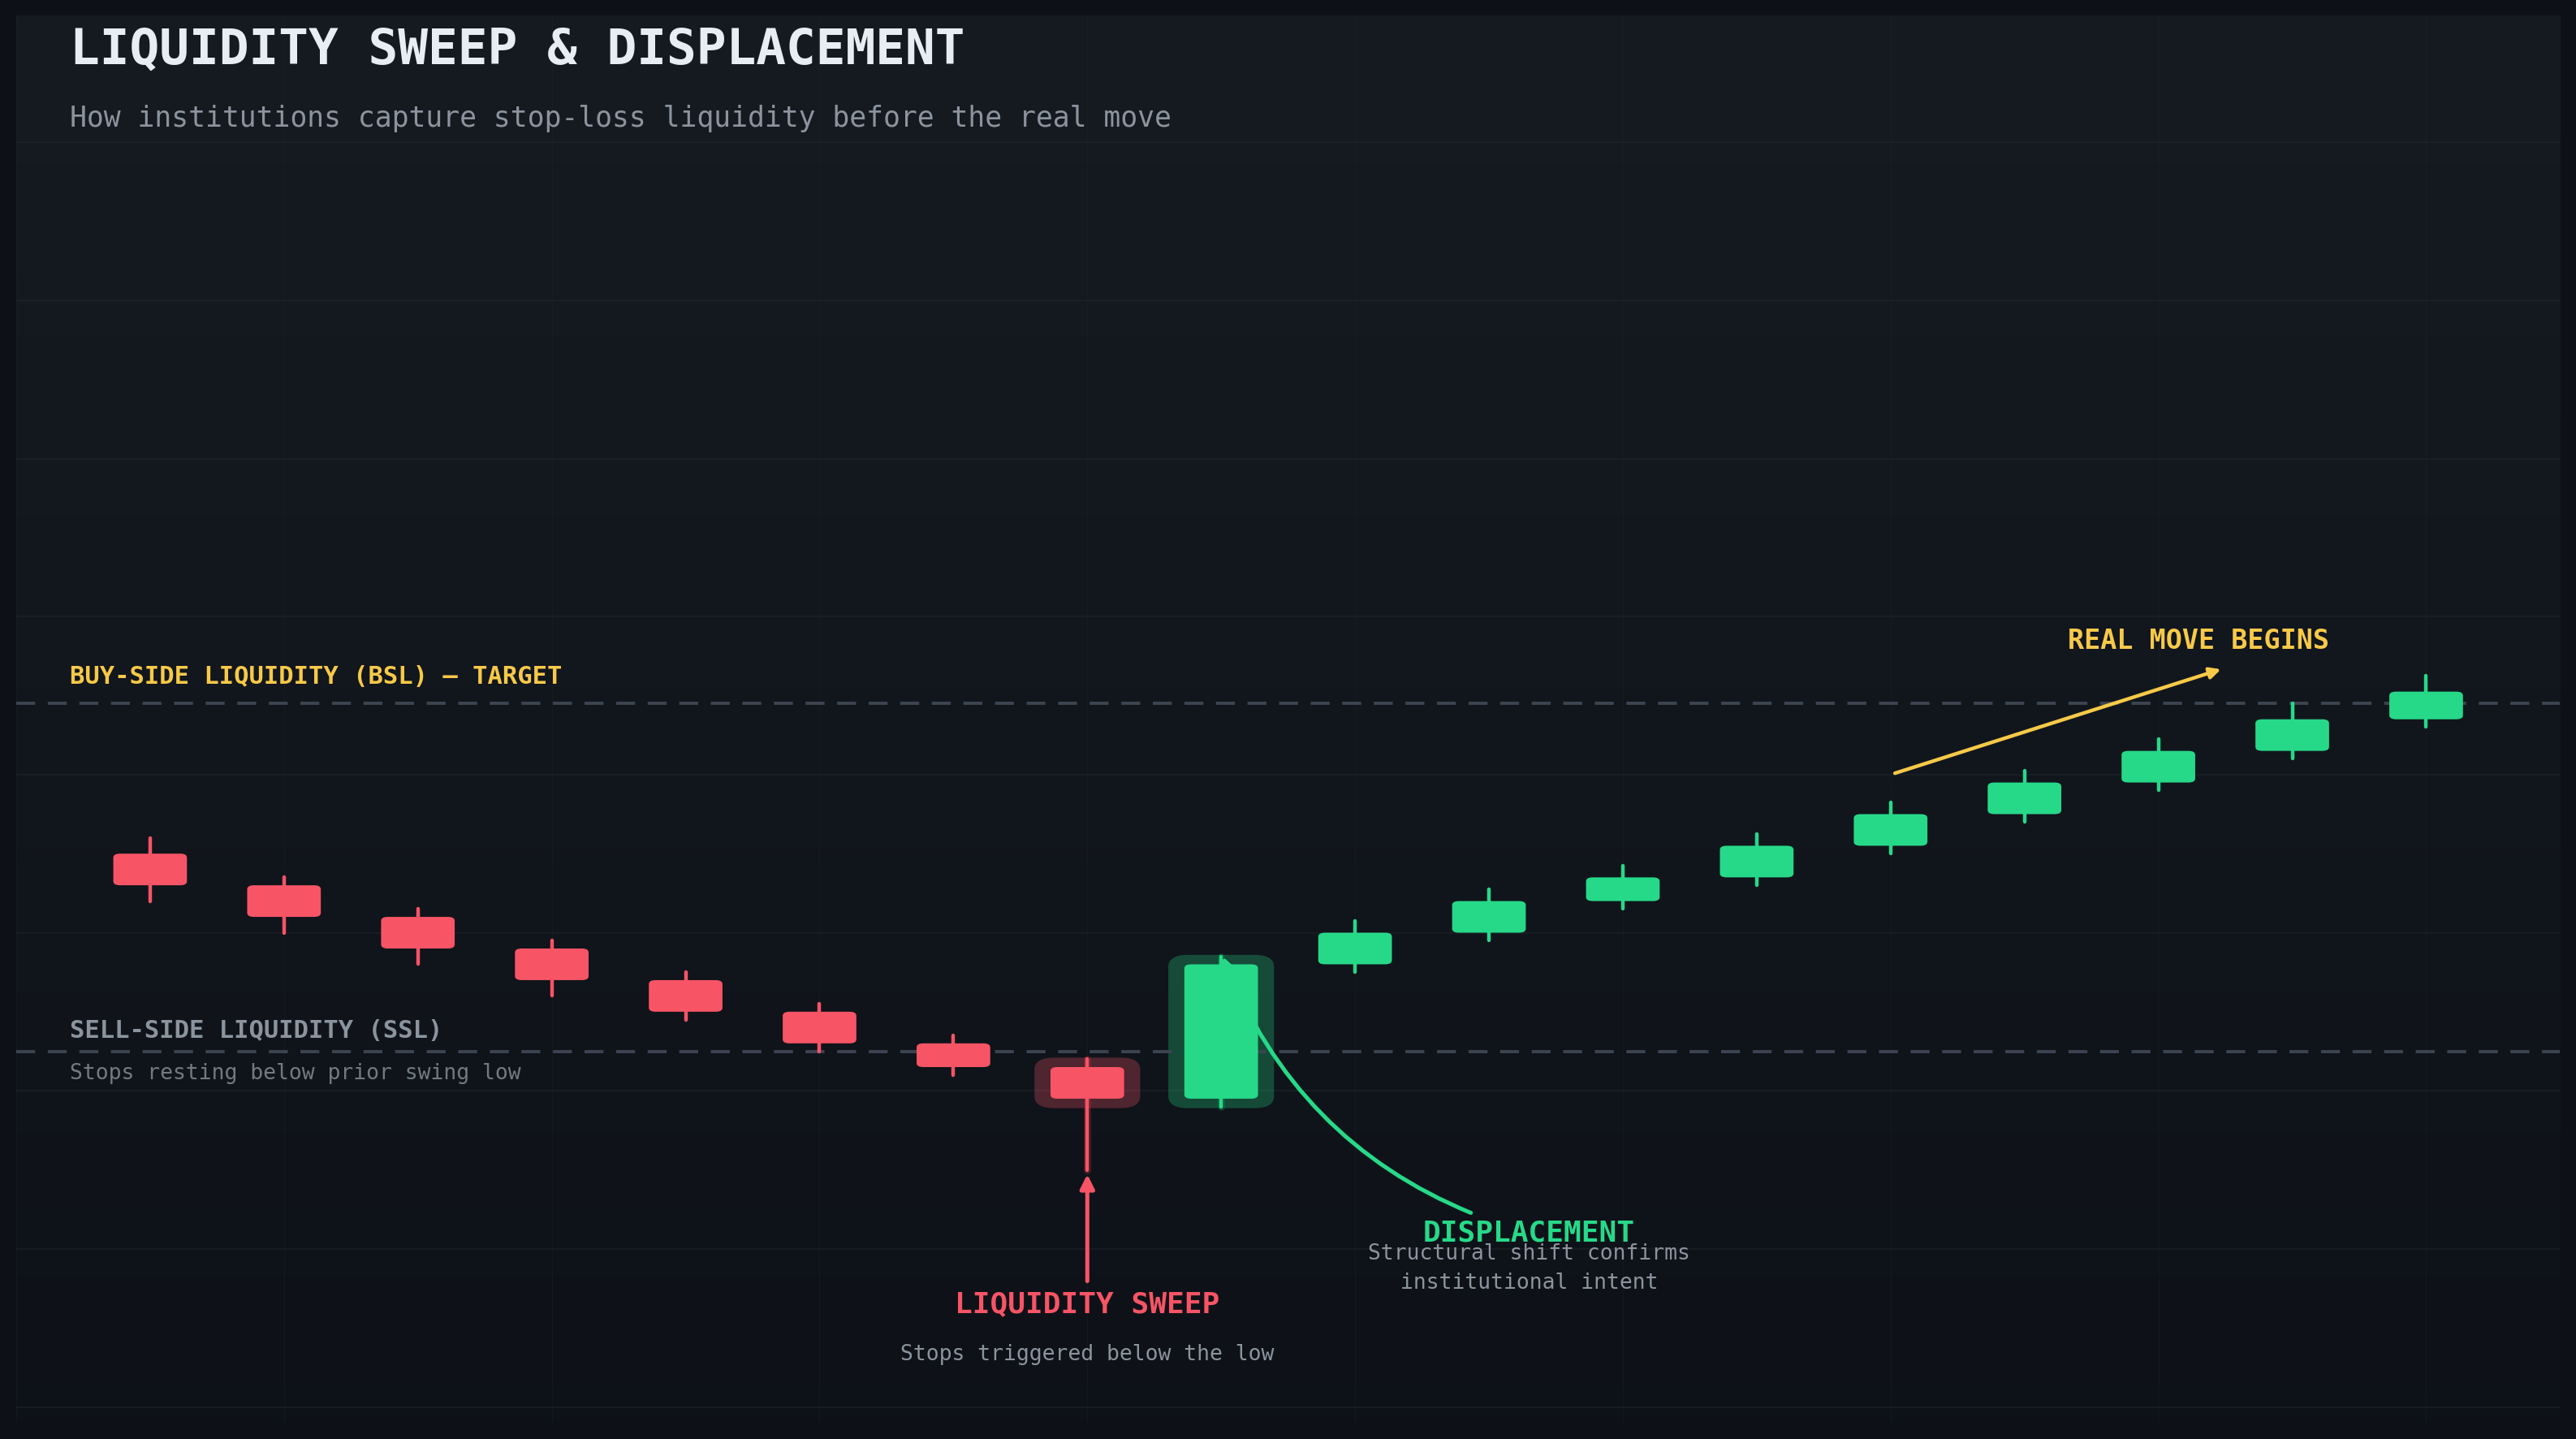
Liquidity sweep & Displacement
Traders who follow Smart Money Concepts (SMC) treat these sweeps as potential entry signals rather than exit points. For example, when price sweeps above a swing high (buy-side liquidity) or below a swing low (sell-side liquidity), and then shows a clear displacement in the opposite direction along with a structural shift, it signals institutional intent. At this stage, the liquidity grab is complete, positions are filled, and the real market move begins.
Buy-Side and Sell-Side Liquidity Zones
Institutional traders focus on liquidity pools rather than traditional support and resistance:
- Buy-Side Liquidity (BSL): Above swing highs, including stops from short sellers and breakout buyers.
- Sell-Side Liquidity (SSL): Below swing lows, including stops from long traders and breakout sellers.
Smart money systematically targets these liquidity pools in sequence. For instance, on a bullish institutional day, the market might start with a manipulation move below the previous day's low to sweep sell-side liquidity. Once those stops are triggered, institutions reverse aggressively upward, targeting buy-side liquidity above prior highs. Retail traders caught in the initial downward manipulation often sell near the low, providing cheap entries for institutions, who then drive the price higher.
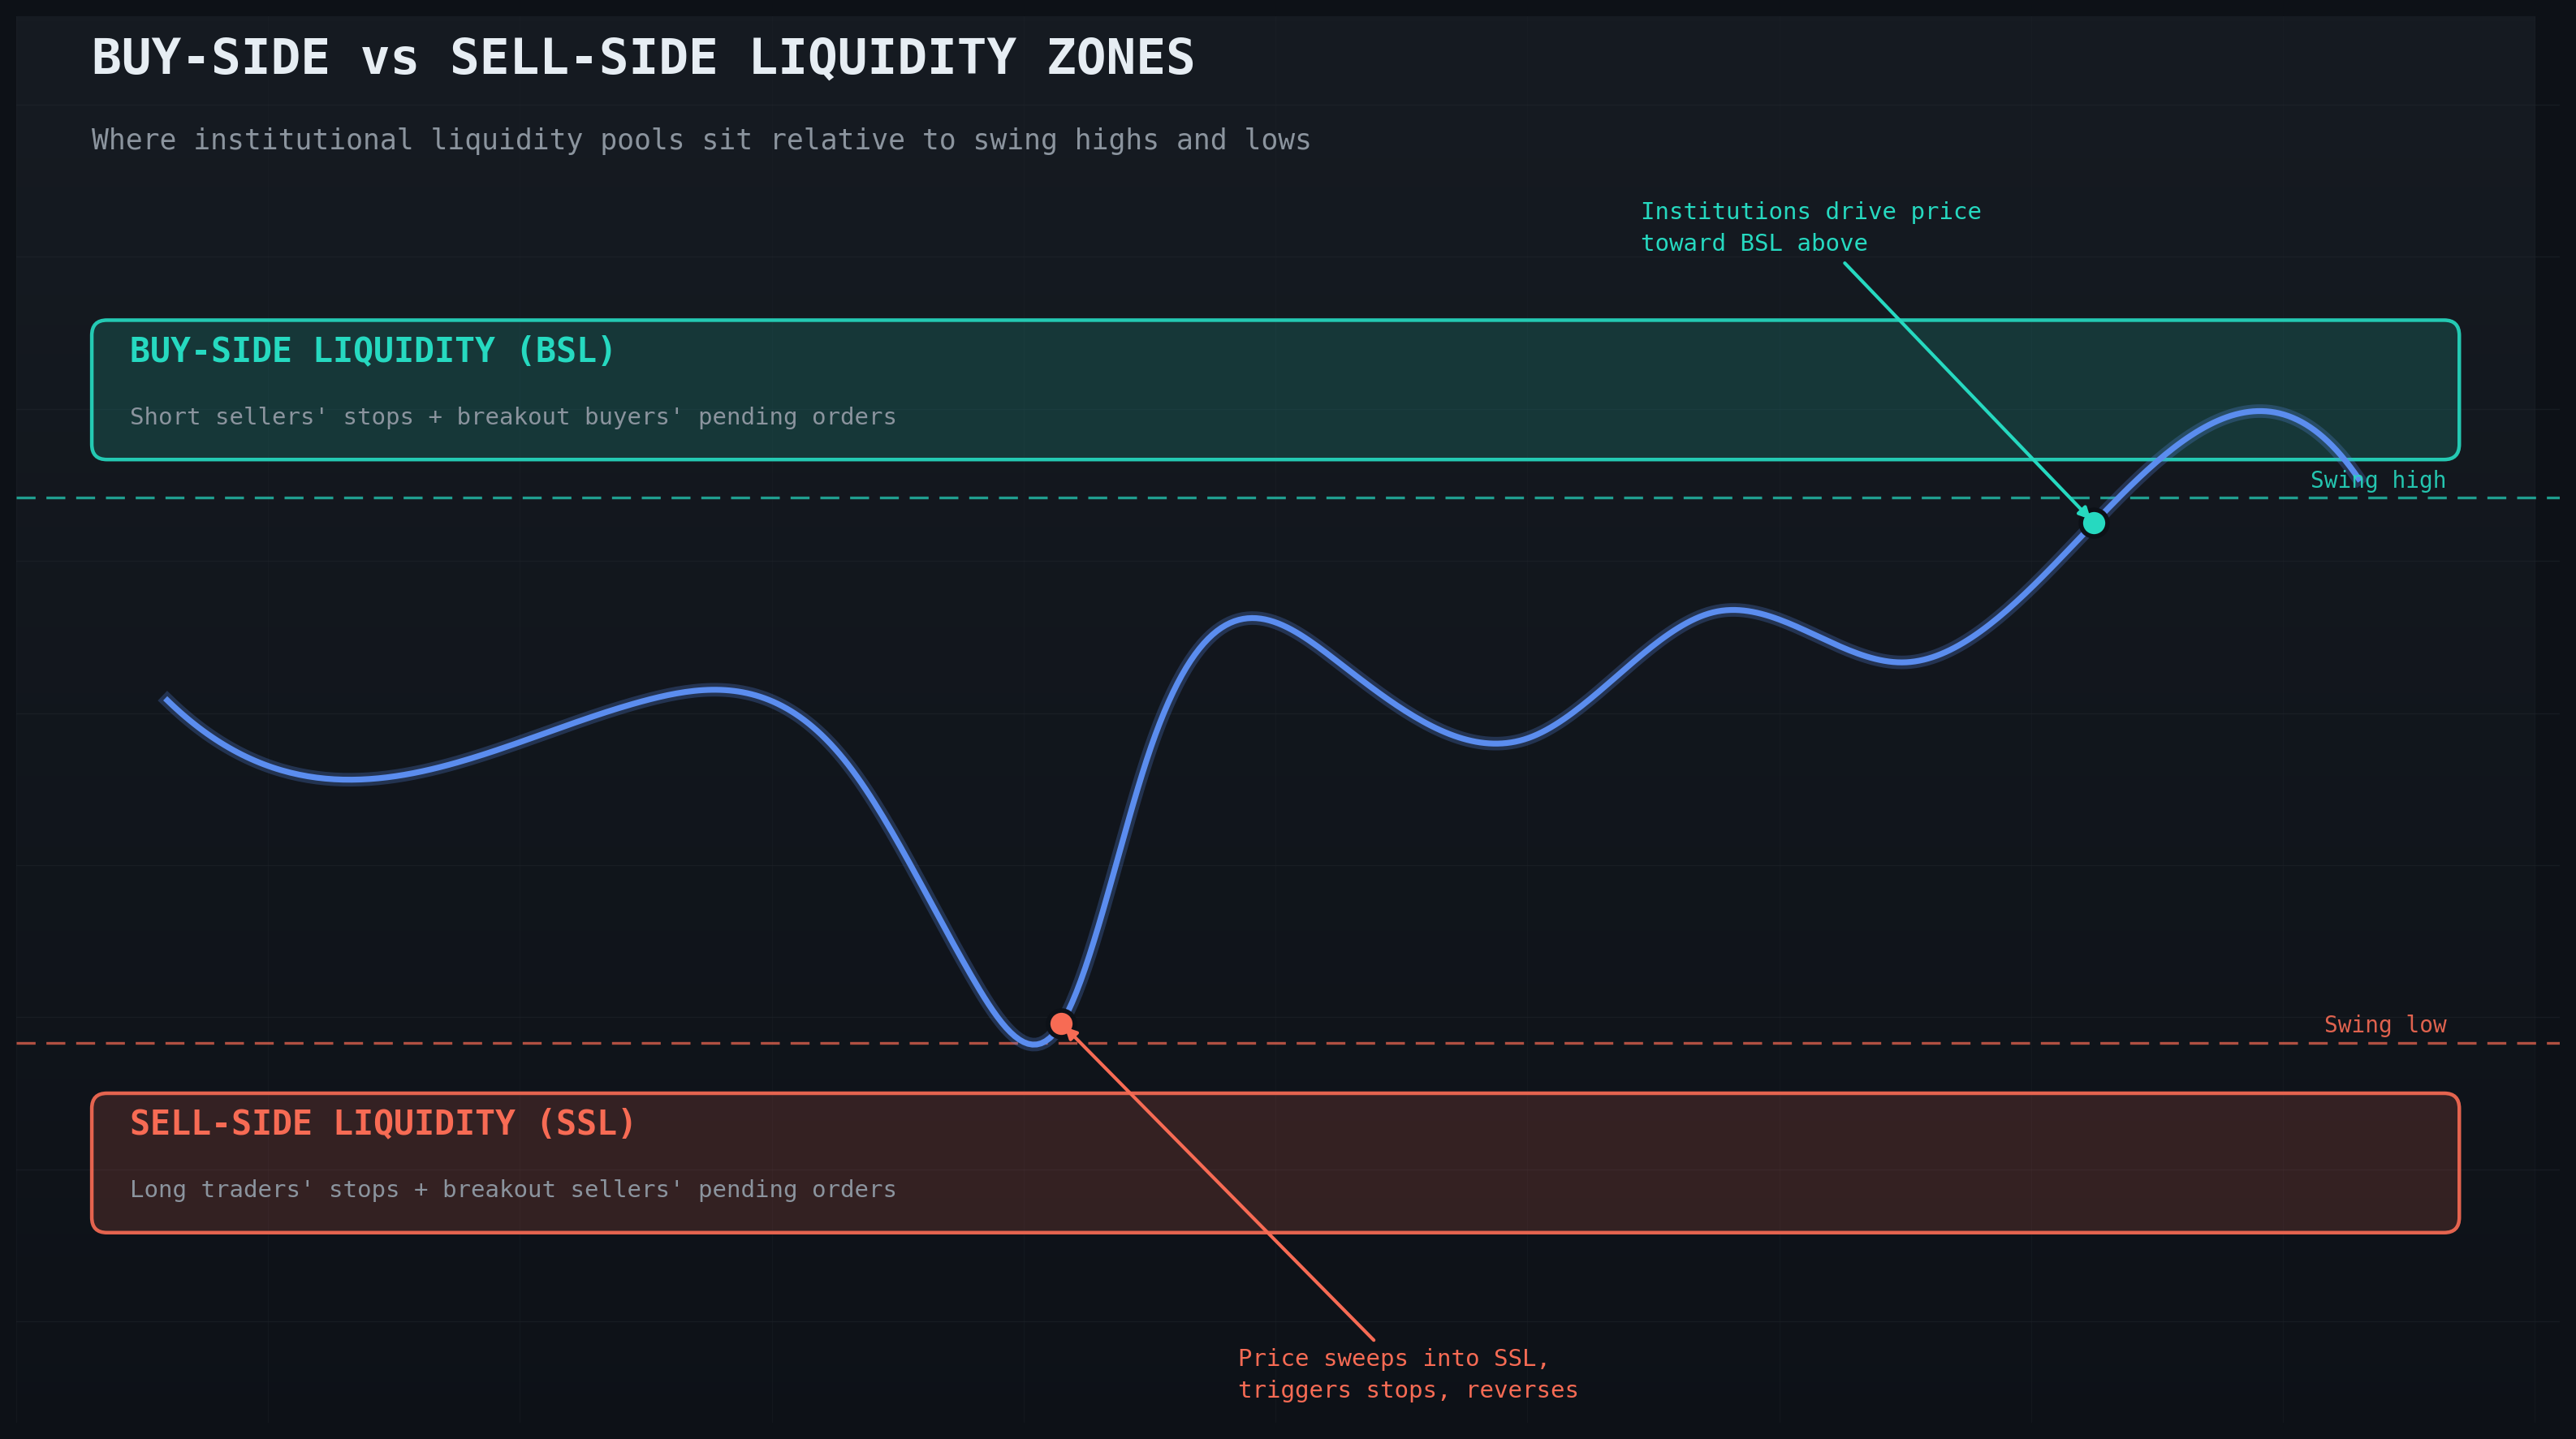
Buy-Side vs Sell-Side Liquidity Zones
FAQ
What is a liquidity sweep in trading? A liquidity sweep is a price move that briefly breaks above a swing high or below a swing low to trigger clustered stop-loss orders, before reversing in the opposite direction.
Is Smart Money Concept (SMC) trading reliable? SMC gives a framework for reading institutional order flow patterns, but it isn't a guaranteed system — it works best combined with risk management and an understanding of market structure, not as a standalone signal.
Where do banks place liquidity sweeps? Typically just beyond obvious swing highs and lows, round numbers, and prior session highs/lows — anywhere retail stop-losses tend to cluster.
Market Maker Manipulation: Broker-Level Exploitation
Retail traders also face exploitation at the broker level. Market maker brokers profit from trader losses and can manipulate spreads or slippage to their advantage. They may artificially widen spreads during news or volatility to trigger stop losses, or narrow spreads on volatile pairs to lure traders into risky positions.
Core Ideas Big Players Use to Execute Their Trades
Large trades are rarely placed all at once — they're split into a "hidden order" (the parent order) executed as many small "realized" trades over time. This splitting behavior is the central engine behind institutional order execution:
- Order sizes follow a power law (heavy tails). A few orders are enormous; most are small.
- Because order flow comes largely from these split-up hidden orders, the buy/sell signs of consecutive trades are correlated (a buy tends to follow a buy). This is empirically a long-memory process — autocorrelation decays as a slow power law, not exponentially, and stays positive out to lags of 1,000+ trades.
- If order flow is this predictable, market makers and liquidity providers must protect themselves. To keep prices a martingale (no easy arbitrage), they make liquidity asymmetric: a trade in the same direction as an ongoing large order moves price less than a trade in the opposite direction. This asymmetry grows as the hidden order continues, since the market becomes more convinced it's real and prices it in.
- This asymmetry — not trader "skill" or information differences — is what produces the well-known concave impact curve (impact grows with size, but at a decreasing rate, roughly square-root-like or log-like, depending on assumptions).
The Mechanism, Simplified
A large trader wants to buy quantity V, splits it into small pieces, and trades at a roughly constant rate (participation rate π).
Each individual trade's price impact depends on how surprising it is — a trade matching what's already expected barely moves price; an unexpected trade moves it a lot.
As the hidden order progresses, its continuation becomes more predictable (participants realize "this is a big one"), so each subsequent execution is less surprising, leading to smaller marginal impact and concavity.
How concave the impact curve is depends on what information or model other participants use to predict order flow:
- Linear/public model (participants only see the public tape of buy/sell signs): impact grows roughly as a power of order size (~N^(1−φ)), and is fully temporary — it reverts completely once the order stops.
- "Colored print" model (participants can identify which trades belong to the same hidden order, near-perfect information): impact grows much more slowly (~log N, or (log N)² once you account for uncertainty about when the order ends), and impact is partly permanent.
- Counter-intuitively, more information revelation about order flow to the market leads to lower asymptotic impact for the trader executing the order, because the market pre-adjusts.
Systems like this, built on algorithms with high computational power, can only be built by big players, because building this kind of system requires substantial capital — potentially millions in funding. That doesn't mean you can't build one — you can — but the level of accuracy institutions achieve is on another level, because they have capital, hidden (insider) information, and resources retail traders don't.
If you want to build a system like this, keep this in mind: trade in slower, smaller pieces to reduce impact (confirmed here — faster trading means bigger impact), and the more anonymous or disguised your order flow looks, the lower your cost stays per trade. But if your order flow isn't well-disguised, expect the impact to be more permanent rather than just temporary.
The Psychology of Manipulation: Fear and Greed
Institutions profit by exploiting human emotions.
Fear causes panic selling, early exits, or missed entries. Institutions engineer volatility spikes, gap-down openings, or aggressive moves to trigger fear, allowing them to accumulate positions at optimal prices.
Greed leads traders to overexpose themselves, chase trends, or enter too late. Institutions exploit greed with false breakouts or momentum surges, distributing their positions while retail traders pile in at the top.
Research shows these emotional patterns are measurable and predictable. Institutions, by contrast, rely on data-driven strategies, not emotions.
Greed: The Other Side of the Coin
If fear causes panic, greed often leads traders into overconfidence and overexposure. After a few successful trades, greed can push retail traders to increase position sizes, hold winning trades too long hoping for even more profit, or jump into trends late, thinking "this time is different." Institutions exploit this behavior through false breakouts and momentum surges that lure retail capital at market tops. By the time greed-driven traders enter, institutions are already distributing their positions into that buying pressure, locking in profits.
Research confirms these emotional patterns are not random — they are measurable and predictable. Psychophysiological studies show that fear often leads to overly cautious, pessimistic risk judgments, while emotions like anger can trigger overconfidence. Institutions don't operate on emotions. Instead, they follow systematic, data-driven strategies designed to profit from traders who do.
Overconfidence and the Illusion of Control
Retail traders often overestimate their predictive abilities, taking oversized positions or neglecting risk management. Institutions exploit this by confirming biases on charts, then reversing the price once positions are committed. The illusion of control makes traders think they can dictate outcomes, but the only aspects truly controllable are risk management and position sizing. Institutions use sudden reversals and gap moves to turn overconfidence into a source of liquidity.
Structural, Algorithmic, and Technological Advantages
- Information Asymmetry: Institutions know more about market conditions, pending orders, and price dynamics than retail traders.
- Order Flow Access: They see large orders, hedge fund positioning, and retail clusters, allowing them to act ahead of major moves.
- Price Discovery Advantage: Institutions lead price movements, while retail traders consistently react too late.
- High-Frequency Trading (HFT) Algorithms: Execute trades in microseconds, detect stop clusters, create phantom liquidity, and process thousands of trades simultaneously. Retail traders simply can't compete at this speed.
Modern institutional trading isn't just about money — it's powered by high-frequency trading (HFT) algorithms and advanced technology that retail traders simply don't have access to. These systems give institutions a huge edge:
- They execute orders in microseconds, front-running retail traders by milliseconds that can make all the difference.
- They automatically detect order flow patterns and stop-loss clusters, allowing institutions to anticipate retail behavior before it happens.
- They can create "phantom liquidity" — orders that appear on the book and vanish instantly to mislead other market participants.
- They process thousands of trades simultaneously across multiple markets, giving them unmatched execution speed and coverage.
The Eternal Battle and the Path Forward
Financial markets are an asymmetric battlefield. Institutional advantages in capital, information, technology, and psychology give banks and hedge funds permanent edges. They don't just trade — they engineer price moves, manipulate liquidity, and systematically extract retail capital.