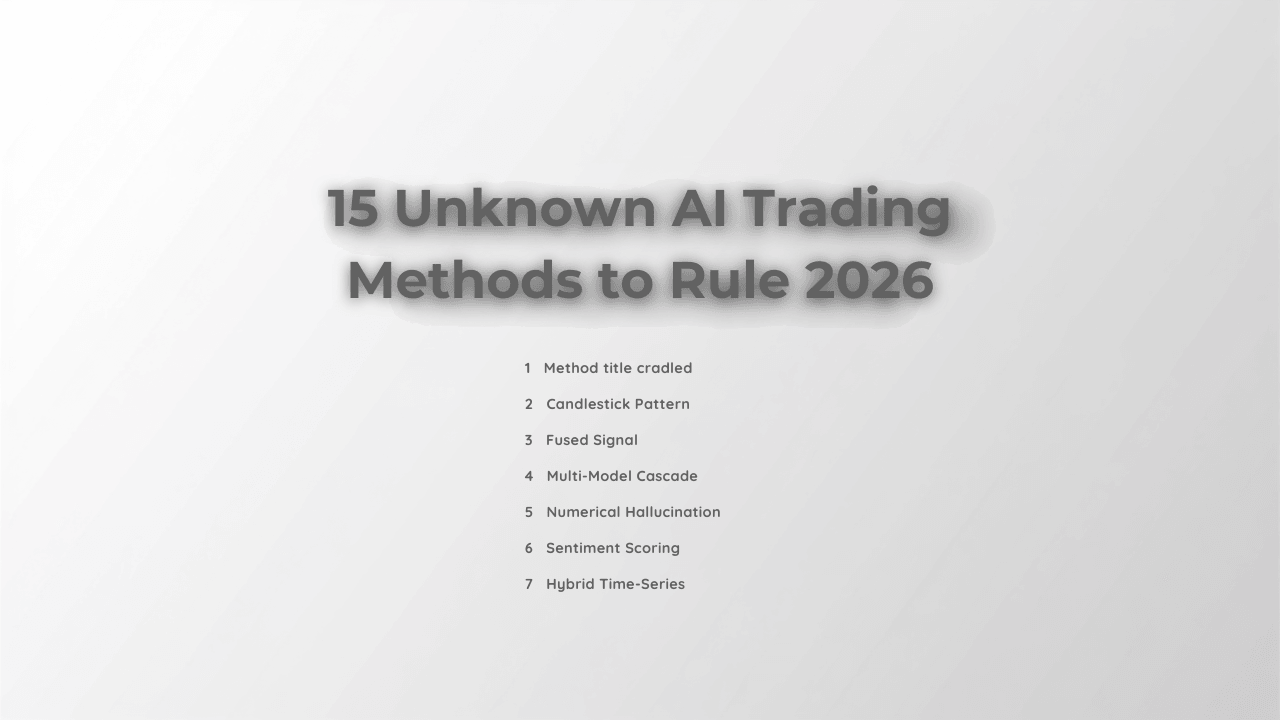

Every trader has heard the pitch by now: feed an LLM market data and let it trade. Fewer people actually know what that looks like in practice—what large language models can and cannot do with candlesticks and Bollinger Bands, what the popular trading frameworks have actually tried, and what happens when you point those same AI techniques at catching traders instead of making them money.
Here is a breakdown of 15 methods being built and tested, how they work, where they fall short, and the unverified claims floating around trading forums.
Part 1: Reading the Chart
1. LLM Candlestick Pattern Recognition
Feed a model five candles of open-high-low-close-volume (OHLCV) data and ask it to spot a Doji, Hammer, or Bearish Engulfing pattern. In controlled testing across five models, a domain-tuned small 7B model edged out GPT-4 Turbo (81.5% versus 80.5% accuracy), with both beating Gemini 1.5 Pro and Llama 3 70B.
The catch is that every model struggled on multi-candle reversal patterns like the Evening Star. Models struggle when they have to reason across three candles at once rather than evaluating a single clean shape.
2. Indicator-Fused Signal Generation
Instead of raw prices, hand the model pre-computed RSI, MACD, and Bollinger Bands alongside a 30-day price window, then ask for a BUY, SELL, or HOLD call.
Across different models, signal accuracy lands in a tight 50–58% band. That is above the 33% random baseline for a three-way choice, but it highlights a persistent reality: one-day directional prediction remains extremely noisy.
3. Backtested Signal-Quality Scoring
Turning signals into simulated trades (full-portfolio entries, 0.05–0.10% transaction costs) allows you to compute Sharpe ratio, Sortino ratio, and maximum drawdown.
In one simulation, a general-purpose model posted a 1.42 Sharpe ratio against a 0.88 S&P 500 benchmark. These figures are strictly illustrative. They reflect idealized backtest conditions without market-impact modeling, not a guarantee of live performance.
4. Domain-Specialized Fine-Tuning (LoRA)
Parameter-efficient fine-tuning—training a small adapter on top of a 7B base model using financial text and numbers—repeatedly delivers performance close to frontier models at a fraction of the compute cost. It is particularly effective for structured pattern-matching tasks.
5. Multi-Model Cascade Routing
No single model wins every task. The practical fix is routing: cheap, fast models handle routine screening, while a frontier model gets reserved for high-stakes calls. This mirrors how production LLMs are deployed outside finance.
Part 2: Reading the Filing
6. Grounded Financial Document Q&A
Benchmarks that test whether a model can pull a correct figure from a 10-K or earnings transcript present a different challenge than reading price charts.
Even top-tier models top out around 65–71% accuracy on these tasks. These benchmarks act as a basic floor rather than a ceiling, and models still miss basic factual questions.
7. Numerical Hallucination Auditing
The most dangerous failure mode is not a bad prediction—it is a fabricated number stated with total confidence.
Across models, roughly 8% to 23% of incorrect answers on financial Q&A tasks contain an invented figure not present in the source document. Any pipeline that feeds model outputs directly into trading decisions requires an automated cross-check step.
8. Regime-Aware Signal Weighting
Signal accuracy that looks respectable in a trending market often collapses when prices move sideways. Tests show signal accuracy dropping from roughly 64% in trending conditions to barely above chance in range-bound markets.
The fix is not writing a better prompt. It requires detecting the market regime first and discounting the signal when conditions turn sideways.

evolution of finance
Part 3: Building the Agent
9. Multi-Agent Trading Firms
Rather than relying on one model to handle everything, several frameworks assign LLMs distinct roles—fundamental analyst, sentiment analyst, risk manager, trader—that debate and hand off decisions. This architecture models how a real trading desk operates.
10. Sentiment Scoring from Text
Converting news headlines, earnings-call answers, or social posts into numeric sentiment scores is one of the more mature use cases in financial AI. Fine-tuned sentiment models consistently beat general-purpose models because they understand domain-specific context—for instance, an earnings "miss" is not neutral, it is negative.
Read the sentiment + technical analysis from my newest post to deeply understand new perspective.
11. Retrieval-Augmented Stock Analysis (RAG)
Rather than relying on static training data, RAG pipelines pull SEC filings, transcripts, and macro data at query time. One system evaluated on S&P 100 stocks over 2023–2024 reported returns ahead of the index. This represents a single test window and should not be viewed as a general rule.
12. Reinforcement Learning from Market Feedback
Instead of optimizing for next-token accuracy, some frameworks reward models directly on portfolio outcomes like Sharpe ratio and drawdown using market P&L. Early implementations show accuracy gains over static prompting, making this a promising direction for aligning model goals with actual trading objectives.
13. Chain-of-Thought Explainable Predictions
A model that outputs a bare "BUY" signal creates compliance issues. Frameworks that force a summarize-explain-predict chain—and train the model via reinforcement learning to keep that chain accurate—outperform direct-answer models while generating an audit trail for regulators.
14. Hybrid Time-Series + Text Architectures
Newer architectures treat price ticks as tokens in the same embedding space as financial text, fusing both into a single sequence rather than combining separate time-series and language models. Early results suggest this approach improves prediction accuracy while reducing memory and runtime costs.
Part 4: AI That Watches the Watchers
15. Graph Attention Networks for Shadow-Trading Surveillance
This method is built to catch traders rather than execute orders. Following the 2024 SEC v. Panuwat verdict—which established that trading on insider information about a related company counts as insider trading—regulators face a massive screening challenge. Out of 1,000 companies, there are nearly a million potential "shadow" pairs.
One graph-based model combines price co-movement, sector affiliations, and governance links into a single network. When tested against the Panuwat case, it ranked the target firm, Incyte, 3rd out of roughly 2,500 equities. Standard correlation screening buried the relationship far down the list. As more capital relies on AI signals, surveillance tooling is scaling alongside it.
Part 5: What Floating Around Trading Forums
Beyond these 15 methods, several other "hidden AI techniques" circulate online. Some describe real quantitative concepts, while others are presented with unearned confidence ("scary-effective," "1–3 day early signal").
Real techniques with established foundations:
Order Book Microstructure Analysis: Modeling bid-ask pressure and liquidity flow is a long-standing quant technique used extensively by high-frequency firms.
Anomaly Detection for Manipulation: Similar to shadow-trading surveillance, this focuses on detecting unusual, coordinated market activity.
Satellite Imagery as Alternative Data: Used commercially for tracking retail parking lots, crop yields, and shipping traffic. It is legitimate data, though framing it as "legal insider trading" is hype.
Hidden Correlation / Pair Discovery: Traces back to 1980s statistical arbitrage. Using modern tools to find pairs is an evolution of an old concept, not a new discovery.
Claims that lack supporting evidence:
- CEO voice emotion analysis for earnings calls
- Micro-price movement fractal fingerprinting
- Weather AI for commodity price forecasting
- Quantum-inspired strategy optimization
- Genetic algorithm strategy evolution
- Institutional money-flow heatmaps
- Social speed index as a leading indicator
- Sleep cycle trading based on session handoffs
- Sub-candle tick prediction
These unverified ideas are not necessarily impossible, but they remain unproven concepts rather than established tools.
The Reality of Back Testing.
Nearly every metric cited above comes from simulated backtests, illustrative datasets, or narrow evaluation windows. Real-world implementation faces consistent hurdles: limited testing outside controlled environments, sparse data beyond U.S. and Chinese equities, and backtest results that disappear once you factor in slippage, market impact, and survivorship bias.
“Your edge isn’t in the chart — it’s in the data. 📊🔍”
"Welcome to the AI era — trade accordingly.”